Measuring the degree of hearing impairment
Audiologists carry out pure tone audiometry, recording the quietest pure tones, usually from 250-8000 Hz, a patient can hear to identify their hearing thresholds as the standard clinical measure of hearing impairment and use those thresholds to initially set how much amplification a hearing aid should provide for that patient. Hearing aids help people with hearing impairments by amplifying sounds to make them louder and clearer.
Audiograms
The audiometry results are represented by an audiogram: a plot of thresholds in dB HL (hearing level; dB SPL adjusted for our differing sensitivity across frequencies) as a function of the standard pure-tone frequencies.
The audiogram provides a metric of basic hearing ability, helps visualise the impairment, and can also be an indicator for certain types of hearing disorders, such as noise-induced hearing loss. One of the primary uses of the audiogram is to set the amplification of hearing aids to provide audibility for that person based on a formula (i.e., applying gain that counters that person’s hearing loss at each frequency calculated from their hearing threshold at that frequency).
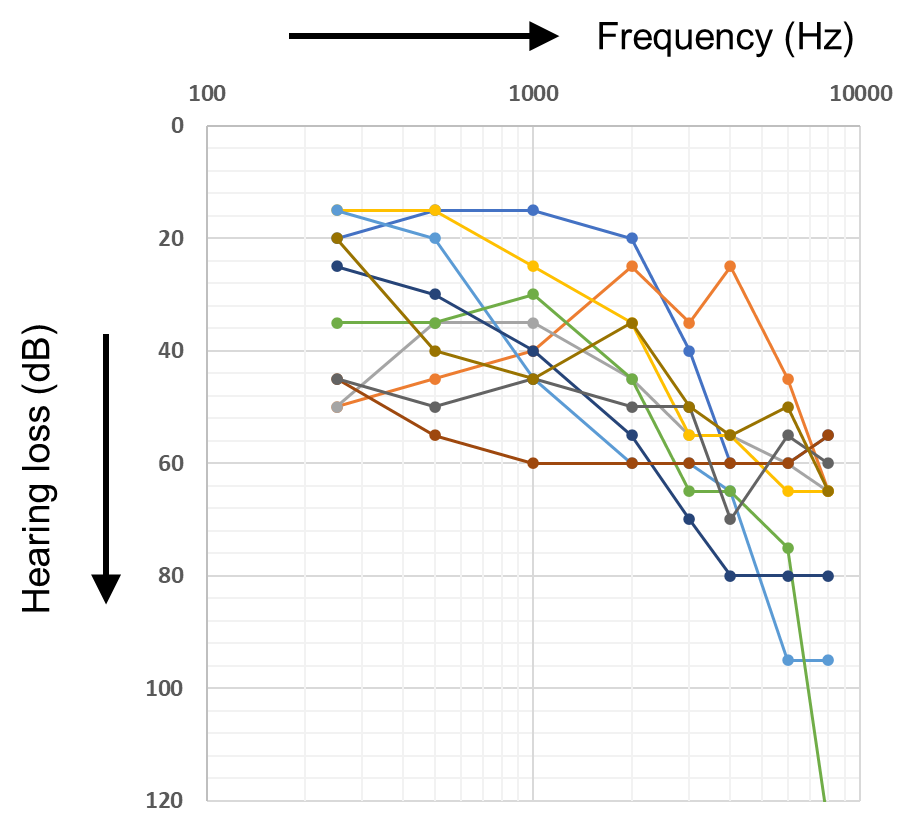
Occasionally audiograms are equal across frequency, or show better hearing at higher frequencies, but by-far the typical audiogram for an older adult shows worse hearing at higher frequencies, sometimes by as much as 60 dB or more (see Figure 1 for examples of real audiograms).
It is usual to calculate an average across frequency to give a single-number value for hearing loss. Many rules for choice and weighting of frequencies have been proposed or used. We use the popular “four-frequency” average: the thresholds at four mid-frequencies important for speech - 0.5, 1, 2 and 4 kHz – are averaged out to give an overall hearing threshold score, usually for the ear with better (lower) thresholds. This better-ear pure-tone average (PTA), has been classified into broad categories, as follows:
| Hearing loss category | Better ear average (dB HL) | Performance in Quiet and Noise |
|---|---|---|
| None | < 20 | No or very slight hearing problems. |
| Mild | 20 - 34 | No problems in quiet but may have real difficulty following conversation in noise. |
| Moderate | 35 - 49 | May have difficulty in quiet hearing a normal voice and has difficulty with conversation in noise. |
| Moderately severe | 50 - 64 | Needs loud speech to hear in quiet and has great difficulty in noise. |
| Severe | 65 - 79 | In quiet, can hear loud speech directly in one's ear, and, in noise, has very great difficulty. |
| Profound | 80 - 94 | Unable to hear and understand even a shouted voice whether in quiet or noise. |
| (Table from Humes 2019) |
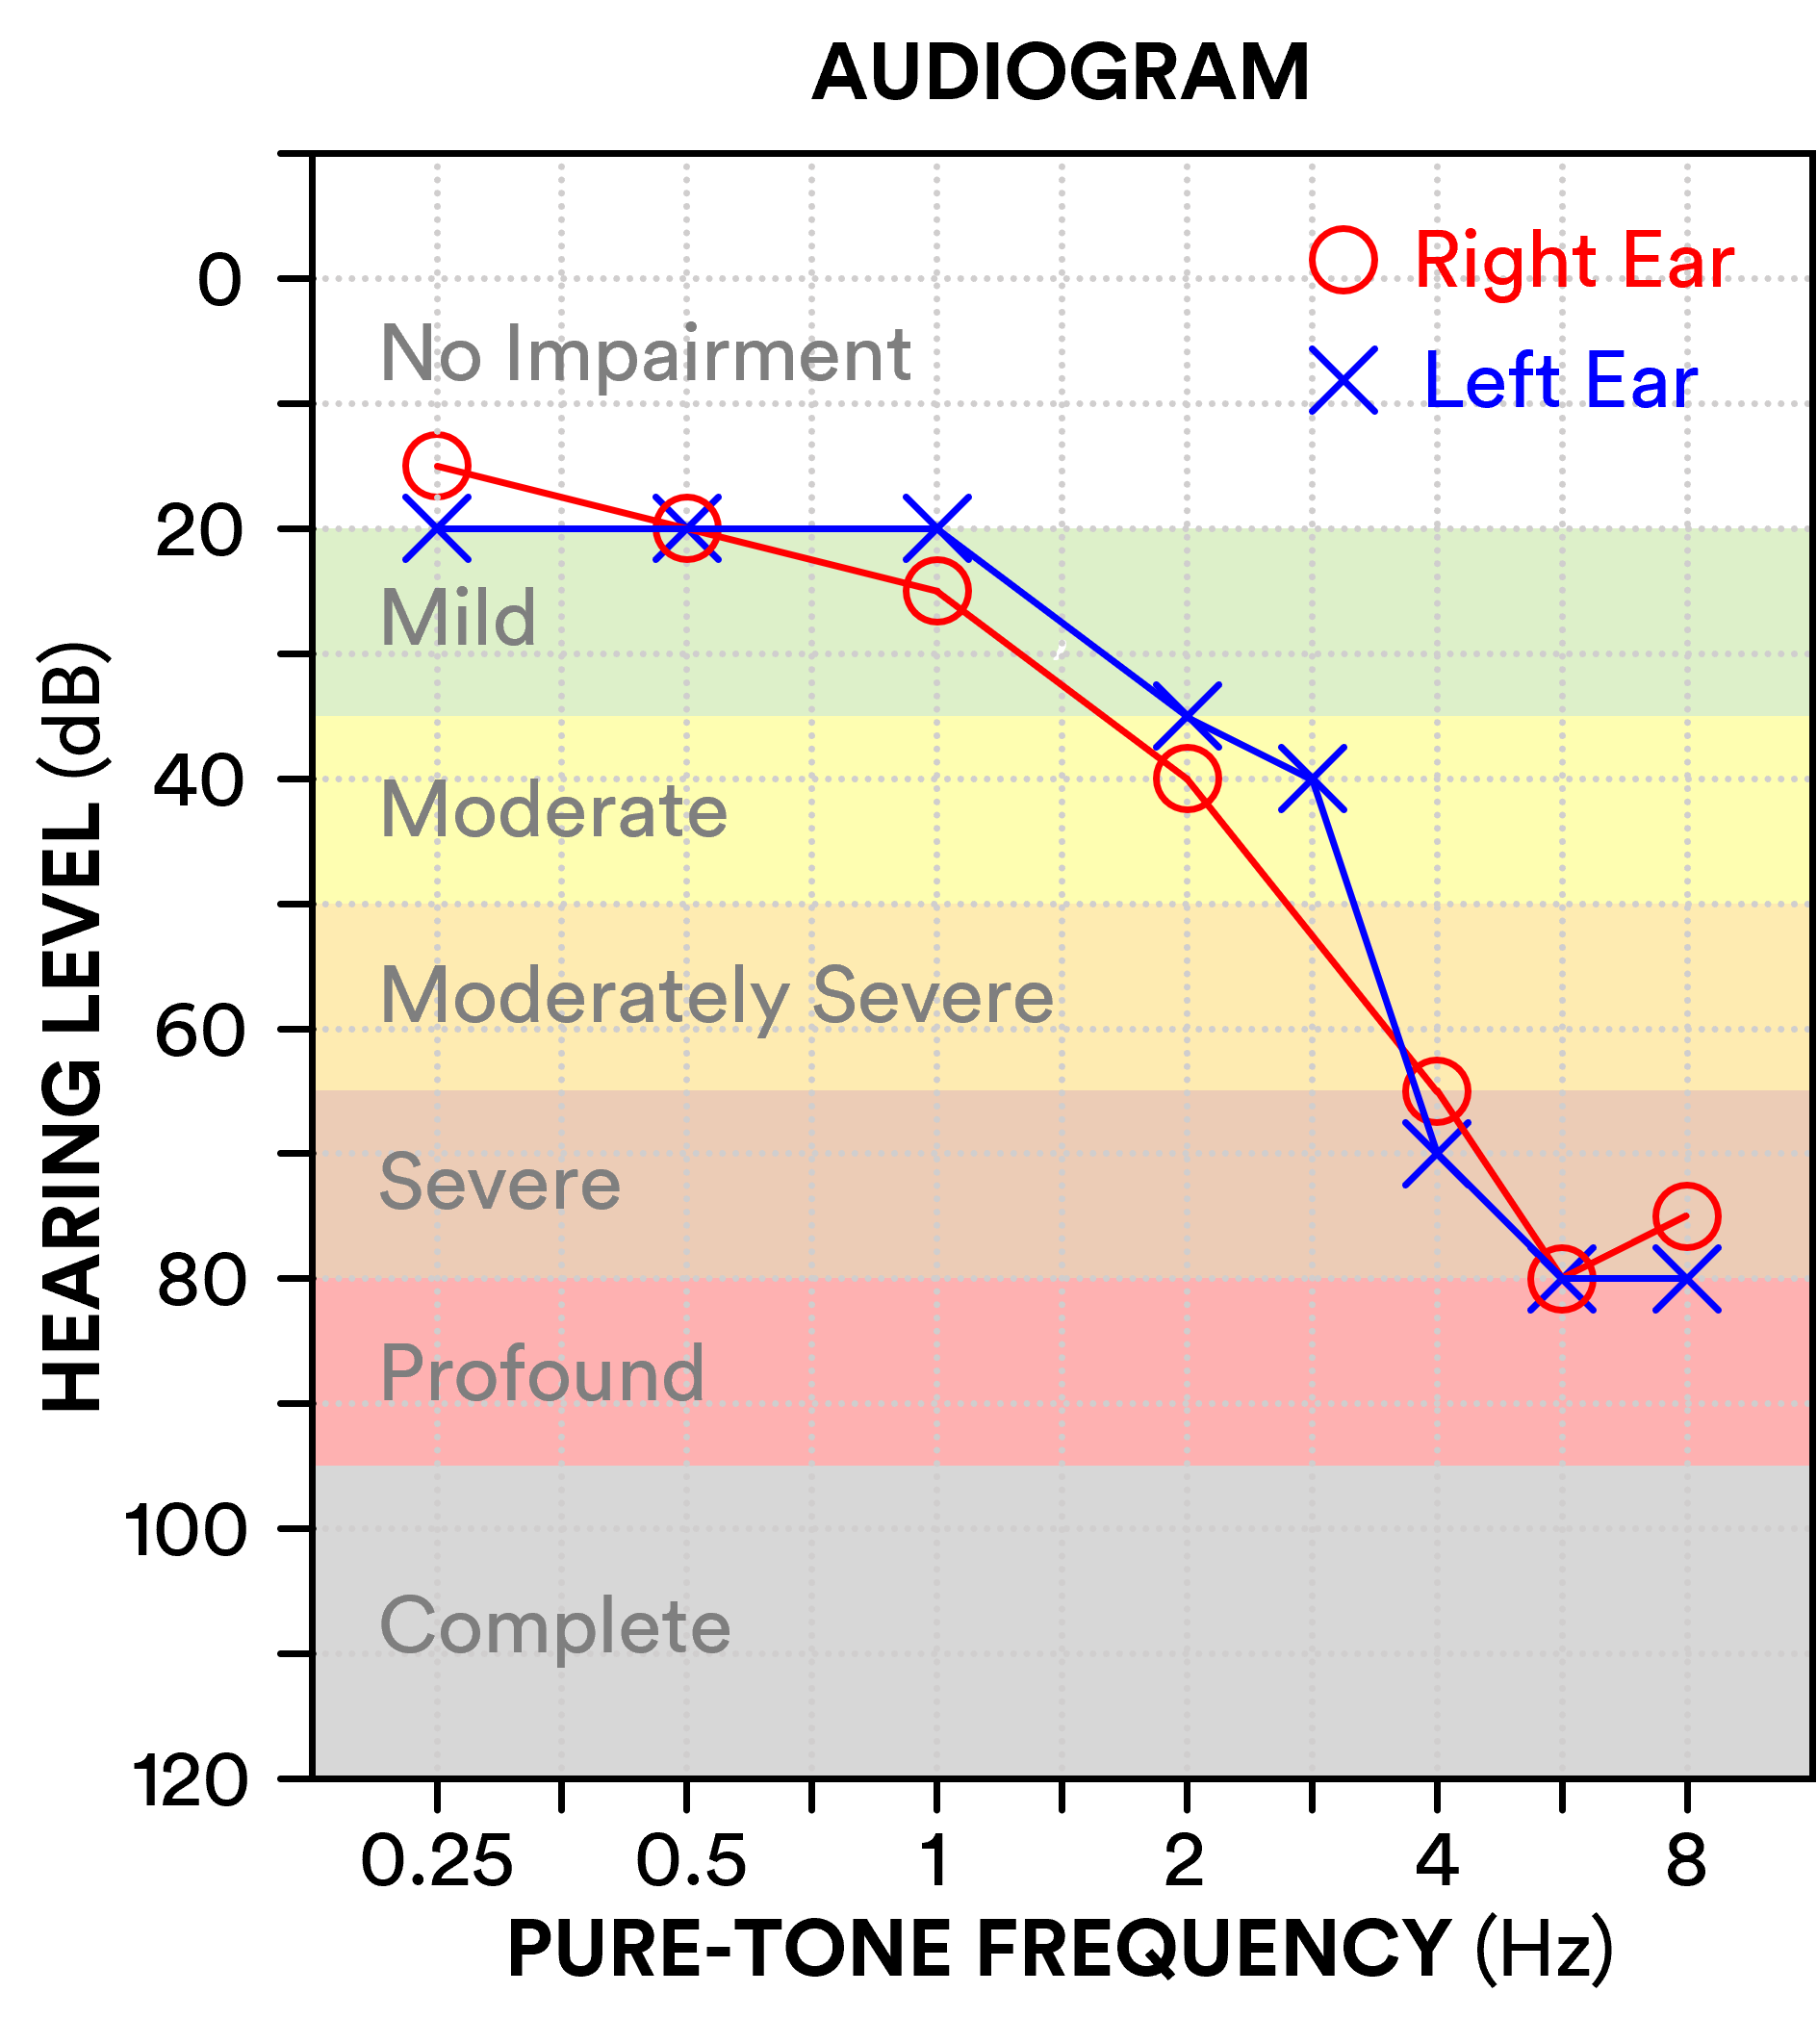
In the following audiogram example, the person has a bilateral symmetrical hearing loss which would be categorised as mild at lower frequencies and severe at higher frequencies. Based on their four-frequency (500, 1000, 2000 & 4000 Hz) average in their better (left) ear, this person would be categorised as having a mild hearing loss (average 36 dB HL). In general, hearing loss tends to be greater (worse) with increasing frequency for older adults and worsens with age at a rate of roughly 1 dB/year.
The threshold values of the audiogram defines how much gain the hearing aid needs to apply, with the calculation typically done by one of a group of "prescription rules", e.g. CAMFIT, NAL-NL2 or DSL.
Note that the scale of an audiogram is in "dB HL" = "dB Hearing Level". This is not dB SPL; instead, it's relative to an international standard such that 0-dB is "normal hearing" at every frequency. For background see Why the Audiogram Is Upside-down | The Hearing Review and The Quest for Audiometric Zero | The Hearing Review
As noted by British Society of Audiology guidelines, 'the ability to detect pure tones in a quiet environment is not in itself a reliable indicator of hearing disability and audiometric descriptors alone shall not be used as the measure of difficulties experienced' (p. 27). Nevertheless, the descriptors provide a useful summary of an individual's hearing ability, and research shows generally consistent patterns of difficulties experienced (e.g., difficulty hearing speech in noisy environments, difficulty hearing out melodies/harmonies in music) within each category. PTA provides a quantitative measurement of hearing impairment necessary for use in the challenges.
For further reading on hearing-aid compression, the following papers may be of interest:
- Effects of Compression on Speech Acoustics, Intelligibility, and Sound Quality - Pamela E. Souza, 2002 – a review of basic perceptual aspects
- Principles of Digital Dynamic-Range Compression - James M. Kates, 2005 – a basic tutorial of WDRC.